|
|

Detecting tsunami damage from Satellite data in Sri LankaL. Kithsiri Perera, Weathernews Inc,B19-Makuhari Techno Garden, 1-3, Nakase, Mihama-Ku, Chiba-Shi, Japan. Email: Perera@wni.com Srikantha Herath, Environment and Sustainable Development, United Nations University, 5-53-70,Jingumae, Shibuya-ku, Tokyo 150-0001, Japan. Email:hearath@hq.unu.edu
1. IntroductionSatellite technology clearly proved its strength through the extensive use of images of damage caused by the December 2004 Sumatra earthquake and tsunami disaster. Mainly due to continue earth surface monitoring capability, satellites are collecting a valuable set of data (images), which is increasingly developing together with the developments of the computer. From the beginning of the disastrous earthquake and the killer tsunami that killed about 0.25 million people, quake and tsunami warning platforms of remote sensing observations were in action by continually monitoring seismic activities. Satellites exchanged and recorded those seismic data though warning systems, unfortunately not implemented in Indian Ocean to inform about the tsunami. As the result, the killer tsunami traveled thousands of kilometers, and reached African coast taking 8-10 hours, without any warning. The result was the largest natural disaster in Sri Lankan history by the terms of deaths and economic damage. But, some other satellites also monitored the disaster and left valuable data to study the damage. In this study, we used freely available those satellite images that shows the before and after tsunami disaster of Sri Lanka and compare with some images of Sumatra. See figure 01 for general area affected by the Sumatra earthquake and tsunami, and the death toll of each country by after one month of the hit.
2. The satellite images of the tsunami disasterEarth surface observing satellites came into use with the launch of Landsat MSS (Multi Spectral Scanner) in early 1970s. Generally, satellites are recording (sensing) earth surface images according to its pre-design program. Some satellites are monitoring single location or rotating parallel to the earth continually (geostationary) like GMS (Geostationary Meteorological Satellites) (http://www.geo-orbit.org/sizepgs/geodef.html ) satellites from about 38,500 km away from the earth. And some are circling around the earth (polar orbiting) and observe entire earth from about 850 km above the earth and completes one circle around the earth once in about 100 minutes. Also there are low Earth Obit (LEO) satellites moving above about 2000 km. Ability to monitor same location (other than specific use such as defense), is not a big advantage unless its not for weather observations (collecting atmospheric data).The ground information recording on satellite images is depending on the image resolution and the image band characteristics. Mainly for media and field observations, high-resolution satellite data are important as visible band images and giving a wider applicability at primary level damage mitigation works. Due to the latest development of satellite technology, there are number of government and commercial satellites providing very high resolution images, like Terra, SPOT, EKONOS, and, QuickBird (http://www.digitalglobe.com/index.php) those are providing images from 2 m to 60 cm resolution. In remote sensing technology, image qualities like, image size, image resolution, and image brightness are important for scientists to understand ground features on satellite images. Here high resolution means, the size of the surface area covered by each pictorial dot (pixel) on the image. Read more basic information at: ( http://imagine.gsfc.nasa.gov/docs/science/how_l1/resolution.html).
3. Before and after tsunami observation with satellite images3.1 Basic informationAs briefly explained in above sections, tsunami images are coming from polar orbit satellite as pre-tsunami images or after tsunami images. On December 26th of 2004 morning, earthquake occurred by 00.58.50 GMT. The geological plate movement (gain of the quake) occurred below 10 kilometers from the seabed off northwest Sumatra triggering the earthquake and tsunami. Within 5 minute its eastern flank of tsunami waves hit Sumatra Island while its western front is racing to Sri Lanka and India direction over the vast Indian Ocean. Though the Pacific tsunami-warning center in Hawaii issued the bulletin with no tsunami warning to that region by 01.14 GMT, tsunami first hit Sri Lanka's eastern coast by 2.30 GMT, destroying all communication with other cities. Tsunami came as multiple waves and secondary waves hit Sri Lanka's south and then southwest coast later. By this hour, NASA's Multi-angle Imaging SpectroRadiometer (MISR) aboard NASA's Terra satellite passed southern Sri Lanka (by 05.15 GMT) recorded the image in figure 02 with clear tsunami features. According to NASA documents, the waves are made visible due to the effects of changes in sea-surface slope on the reflected sun-glint pattern, shown here in MISR's 46-degree forward-pointing camera. Sun-glint occurs when sunlight reflects off a water surface in much the same way light reflects off a mirror, and the position of the Sun, angle of observation, and orientation of the sea surface determines how bright each part of the ocean appears in the image. The resulted image shows tsunami features and also confirms the fact that regional changes of tsunami wave moving direction according to shape of the confronting land mass. Ripples in the image when compare to Sri Lanka, are about 45km long or about the distance from Galle city to Matara. Also, its worth to notice the waves have adjusted to the land and sea surface geographical shape, and curved along the southeast bent of Sri Lanka. 3.2 The direction of tsunami wave Number of satellite images appeared over the inter-net for free use of research and informational from various organizations, just after the Tsunami. Figure 03 upper and lower compares a pair of before and after disaster QuickBird satellite images of Kalutara beach of Sri Lanka. Nearly 60% of Sri Lanka's coastal area suffered damage from tsunami and Kalutara was the most westward area came under considerable damage. This area received relatively less damage compare to southeast and east of the island, but these available images are clearly showing some important features of the disaster. The length (horizontal) of a normal (under normal conditions) wave is about between 15 m to 60 m on QuickBird pre-tsunami satellite image. In the sub-section of the tsunami image (figure 03, below), a secondary returning tsunami wave is as long as more than 450 m. As mention earlier, these tsunami waves hit to Kalutara beach were moved TO the direction of the epicenter, or west TO east, perhaps due to the round shape of Sri Lanka. This change of direction can be observed in satellite images (figure 02) and also in mathematical models produced to demonstrate tsunami movement. 3.3. The behavior of waves Due to the high-resolution fact of QuickBird images, the inland land cover information and retreating features of the waves have recorded clearly. The first wave moved into the land and then retreat while raking the all destroyed and other moveable things along the beach to hundreds of meters into the sea (see the broad sea bottom feature in figure 03, below image). Water rushed with the wave to inland cut new canals by force and flow-back into the sea as indicates here (see marked features on images). Some observations of this feature are included in the other paper by the author in this issue. 3.4. Submerged by sea The figure 4, the second pair of Kalutara images is showing flood features recorded by QuickBird satellite. The extent of the seawater moved into the land and physical damage done to the houses can be extensively visible in these images. Later, soon after the disaster, field research teams used some of these images as valuable ground truth information when conduct damage assessment studies. This region has never experienced a similar disaster in known history and has constructed houses and other buildings according to individual needs and economic wealth like other parts of Sri Lanka. Image shows not only by the inland rush of the tsunami, but also by water that return to sea has did a great damage for houses (location A, see beach side houses are surviving while the land side house is disappeared). Also, the thick layers of coconut trees (C) have acted as strong natural barrier against the waves to protect both lives and houses. The after image shows damage area by purple line and some buildings to suitable for further detail ((D) and STATION) field investigations. Muddy color tar road and water filled inland low lands are showing the boundary of the flood movement. Specially, this particular image became popular among many media presentations due to its sharp feature of water flow back to the sea (B).
3. 5. The destruction The disaster features of Sri Lanka recorded by satellite images are difficult to compare with Sumatra field conditions, where faced the biggest earthquake occurred in world within last 40 years. When tsunami struck with full force disaster hit areas in Sumatra already devastated by the earthquake, and in most of the cases, people hit by the tsunami even before they move out of quake-damaged houses. The damage was so extensive in Sumatra as clearly visible in high-resolution satellite data (see figure 05). Since the earthquake destroyed houses and other structures, it's unclear in most areas of Sumatra that the resistance power of coconut and other tree structures against tsunami force. Also, tsunami heights and force also differs from location to location. In figure 05, compare the before (A) and after (B) images of Meulaboh area of northern Sumatra. But, when Sri Lanka and Sumatra field data combine into a GIS database; the achievable results are extraordinary valuable for damage assessment studies. This is due to the observation possibility of the building strength, concrete strength; advantages of different land cover types, and other trees types (perennial crops) under each category of damage (see table 01 for explanation of tentative damage classes). As an example, only the railway station (an iron structure) can be pointed out in figure 04 (lower) as a disaster-escaped structure, which is standing with less damage close to the beach. Also, its important to emphasize that this area (Kalutara) only had less force of tsunami waves and much of the damage did by heavy flood that no building ever used to face.
Generally, affect or the damage from a tsunami is depending on two major factors, 1. The force associates with the tsunami and, 2. The physical and economical factors associate with the facing coastal area. Then, the force associates with the tsunami is depending on, strength of the quake, depth of the epicenter, seabed geography, and, time or distance that tsunami takes to travel. The later factor (or the level of damage) is depending on and shape of the beach, land cover, soil types, elevation, resistance strength of man made structures, and prevailing weather. When field information of before and after disaster link with above mentioned information, further detail level assessments can be worked-out. As we observed in this study, a bulk of disaster mitigation tasks can be organized by using satellite images. Such approach helps not only to plan secondary level field investigation, but also to minimize the fieldwork cost, work amount, and time. From the other hand, there is no any alternative information source compare to fine resolution satellite images. Since flood occurred by tsunami moved just within few hours, accidental or urgently tracked satellite images are providing an extremely valuable source of information. Even a conventional aerial survey will not able to replace this valuable role, compare to the semi-real time factor that satellites gave by their digital images.
 Table: 01. A tentative classification of damage information can be identified with satellite data under different disaster type or combination of earthquake and tsunami.
References; http://digitalglobe.com/ http://earthobservatory.nasa.gov/Newsroom/NewImages http://geo-orbit.org/sizepgs/geodef.html http://globalresearch.ca/articles/CHO501A.html. Why news did not go? http://imagine.gsfc.nasa.gov/docs/science/how_l1/resolution.html http://noaa.gov http://polarbear.css.cornell.edu/srilanka/default.asp for Sri Lanka tsunami data from Cornell University. http://prh.noaa.gov/itic/more_about/itic/itic.html http://usgs.gov |
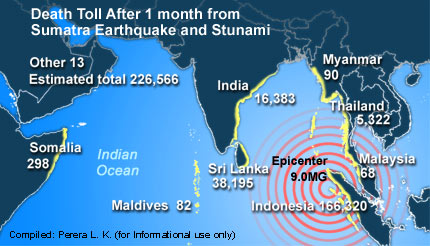 Figure 01.Figure 01. The death toll after a month of Sumatra earthquake and tsunami disaster.
Affected areas are in yellow (light colored coastal area).
	Figure 01.Figure 01. The death toll after a month of Sumatra earthquake and tsunami disaster.
Affected areas are in yellow (light colored coastal area).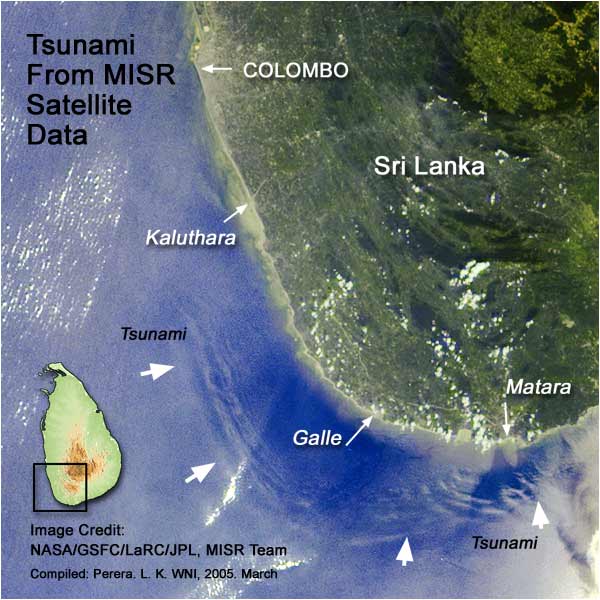 Figure 02. Tsunami hit to southern Sri Lanka detected by a satellite, successfully.
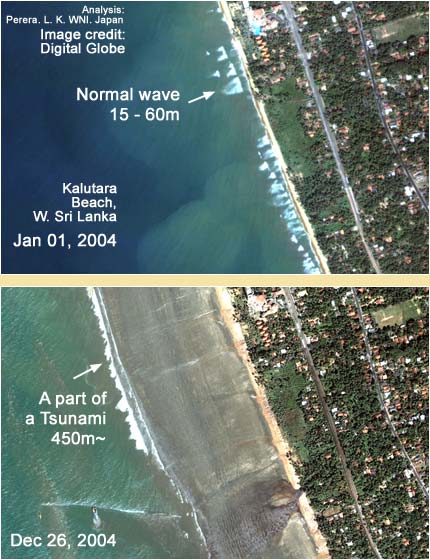 Figure 03. QuickBird images of before and after tsunami. Kalutara, western of Sri Lanka.
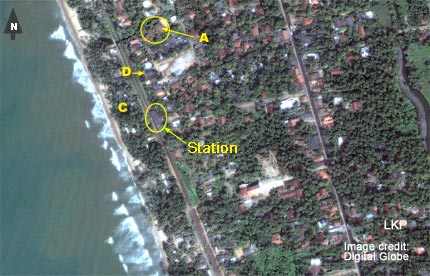
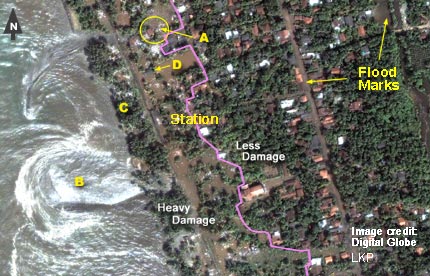 Figure 04. QuickBird images of before and after tsunami. Kalutara, western of Sri Lanka
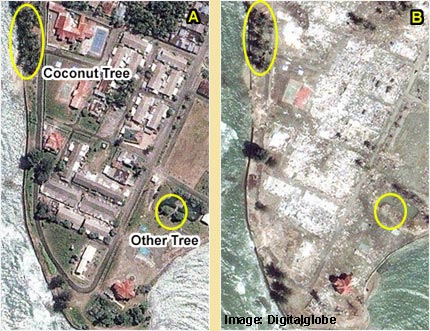 Figure 05. Northern Sumatra faced a total disaster from the earthquake and tsunami.